

How to Turn a CSV into Interactive Charts with Claude Code

Press enter or click to view image in full size
![]()

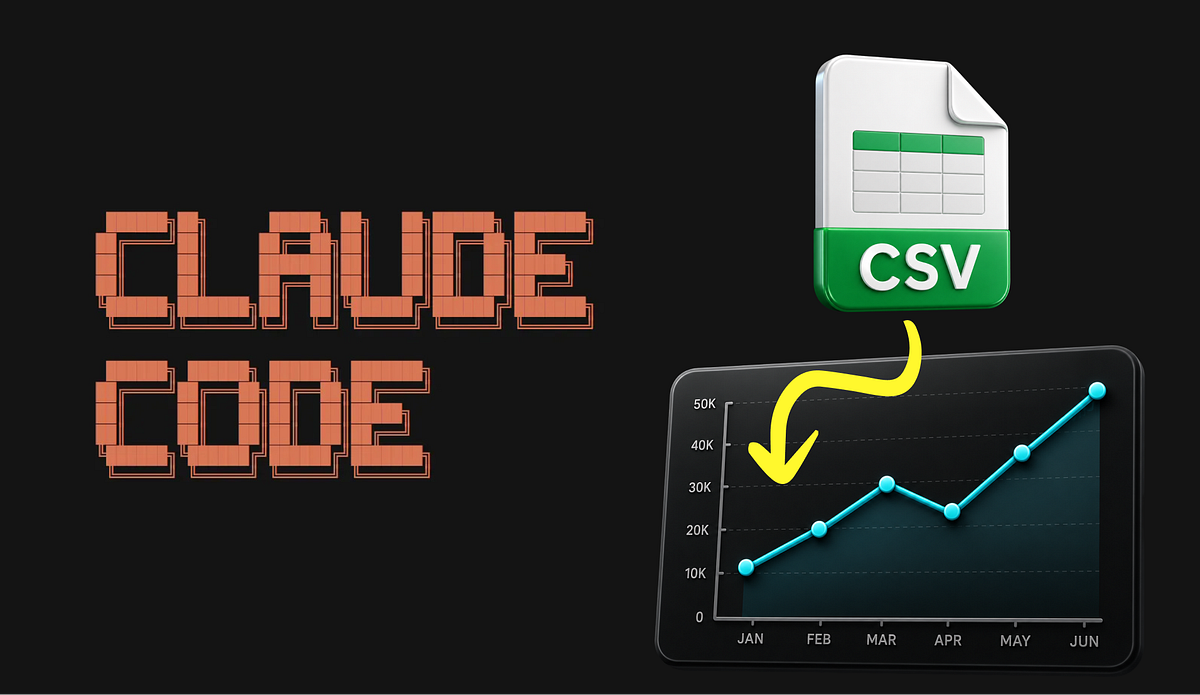
CSV files are one of the simplest ways to store data, but they are not always the easiest way to explore it.
You can open a CSV in Excel or Google Sheets, manually select columns, choose a chart type, and adjust the visualization. That works for a…